Live · 2026 forecasts for GB wheat and US maize →

Every field,
measured.

RayX is building a trustworthy measurement layer for farmland, starting with crop yield — so every field can be measured, compared and audited from space.

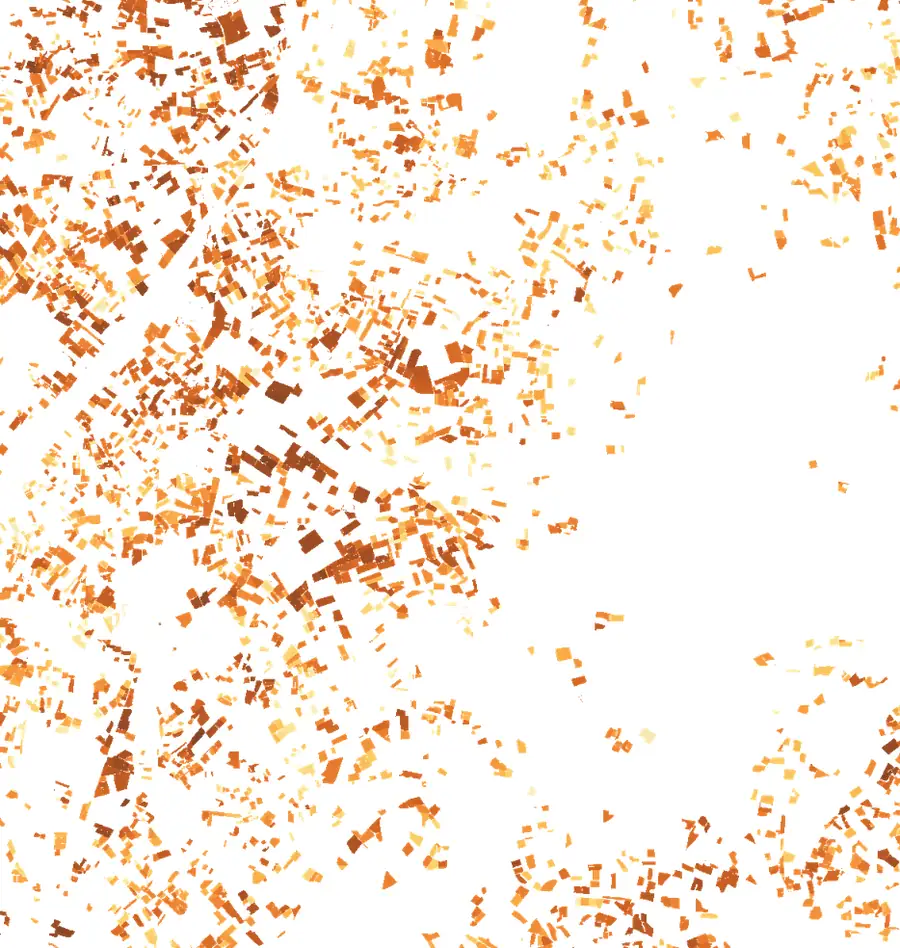
Real outputs: 2026 GB winter-wheat field yields in East Anglia (UCL · NCEO · UKCEH · AgZero+), with figures from the GB wheat, US maize and Field Passport services.

Decisions are made months before the harvest is counted.

Official yield figures arrive long after the crop is cut, and satellite estimates rarely show how they were made. RayX can issue weekly from May — field by field, with intervals, and a record that can't quietly change.

2026 season timeline: RayX can start forecasting from May; in 2026 it published weekly winter-wheat issues from 13 July to 17 August, with a yield cutoff on 1 August and a frozen call on 17 August. Harvest ran from late July to mid-September. Defra's provisional estimate for England is expected in October and the UK final in December.

2026 season · The 2024 UK final was published on 12 December 2024 — and official figures are themselves revised

What we're working towards

Every crop field measured, compared and audited from space — starting with wheat and maize.

One consistent, independent record of what land has produced, is producing and could produce — whoever farms it, and whatever records they keep.

Live today, in the UK and the US.

Field Passports, plus in-season forecasts for GB wheat and US maize, validated against harvester yield data. Open them, explore, then tell us what you'd need.

GB wheat · area by region

1.56 Mha mapped · 200,161 fields

  • East of England412
  • East Midlands287
  • Yorkshire & Humber204
  • South East186
  • West Midlands129
  • South West129

Thousand hectares, top six regions · issue of 17 Aug 2026

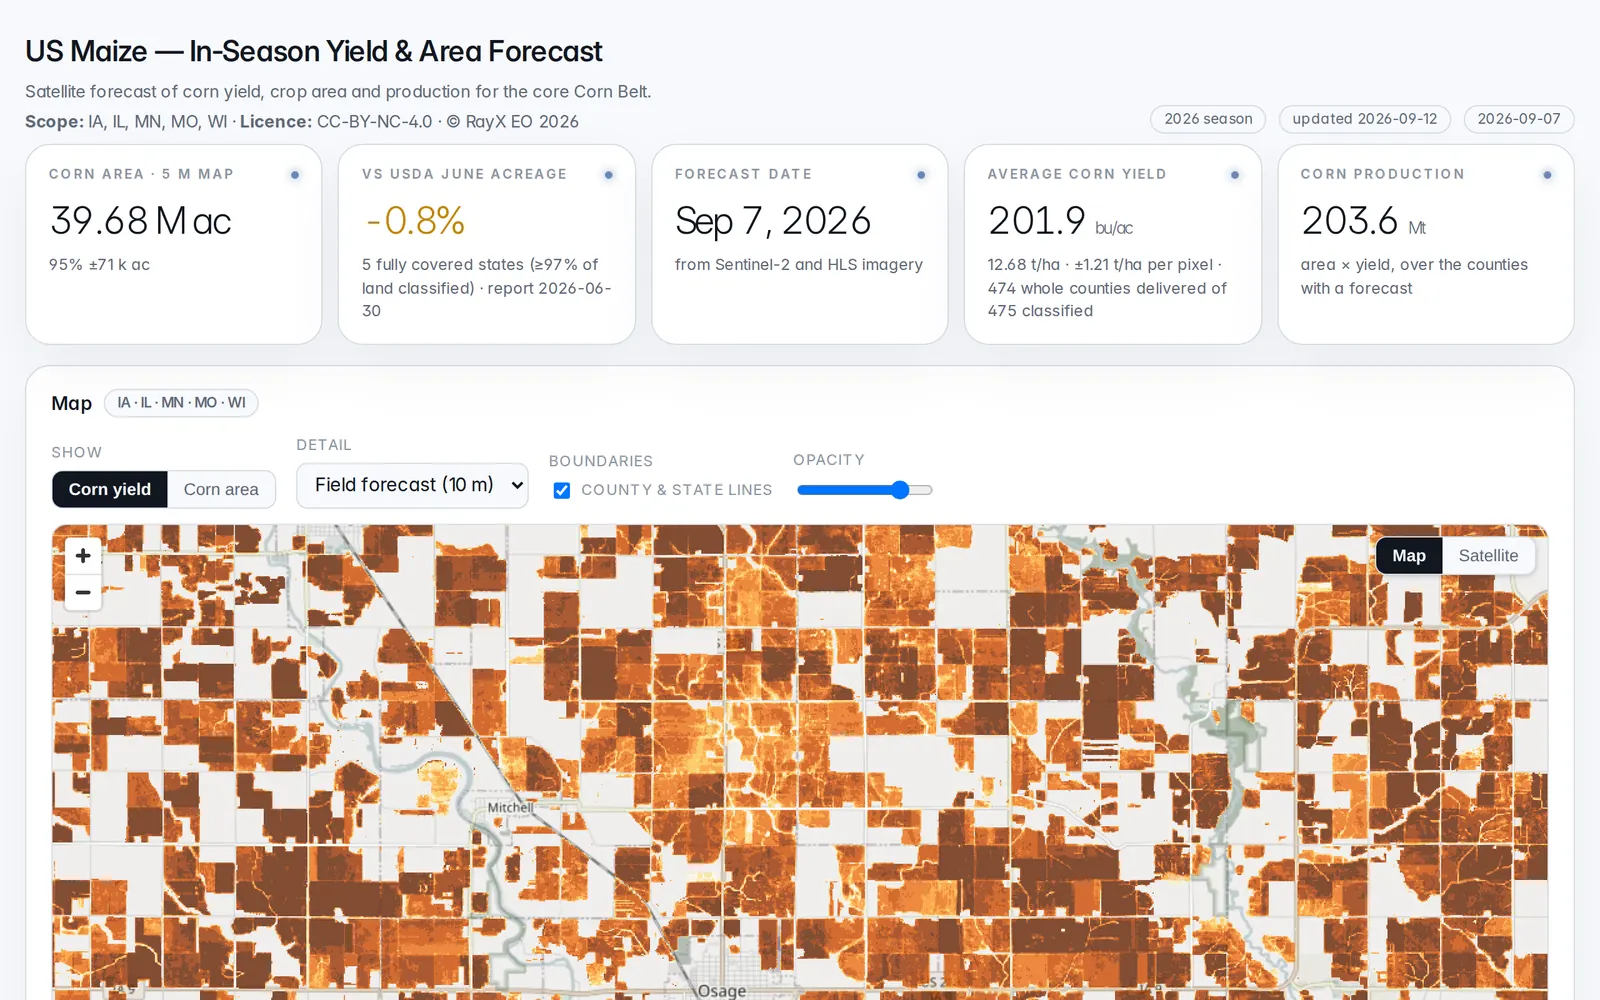
US maize · production by state

203.6 Mt forecast · 474 counties

  • Iowa68.5
  • Illinois55.7
  • Minnesota45.2
  • Wisconsin17.9
  • Missouri16.2

Million tonnes · issue of 7 Sep 2026

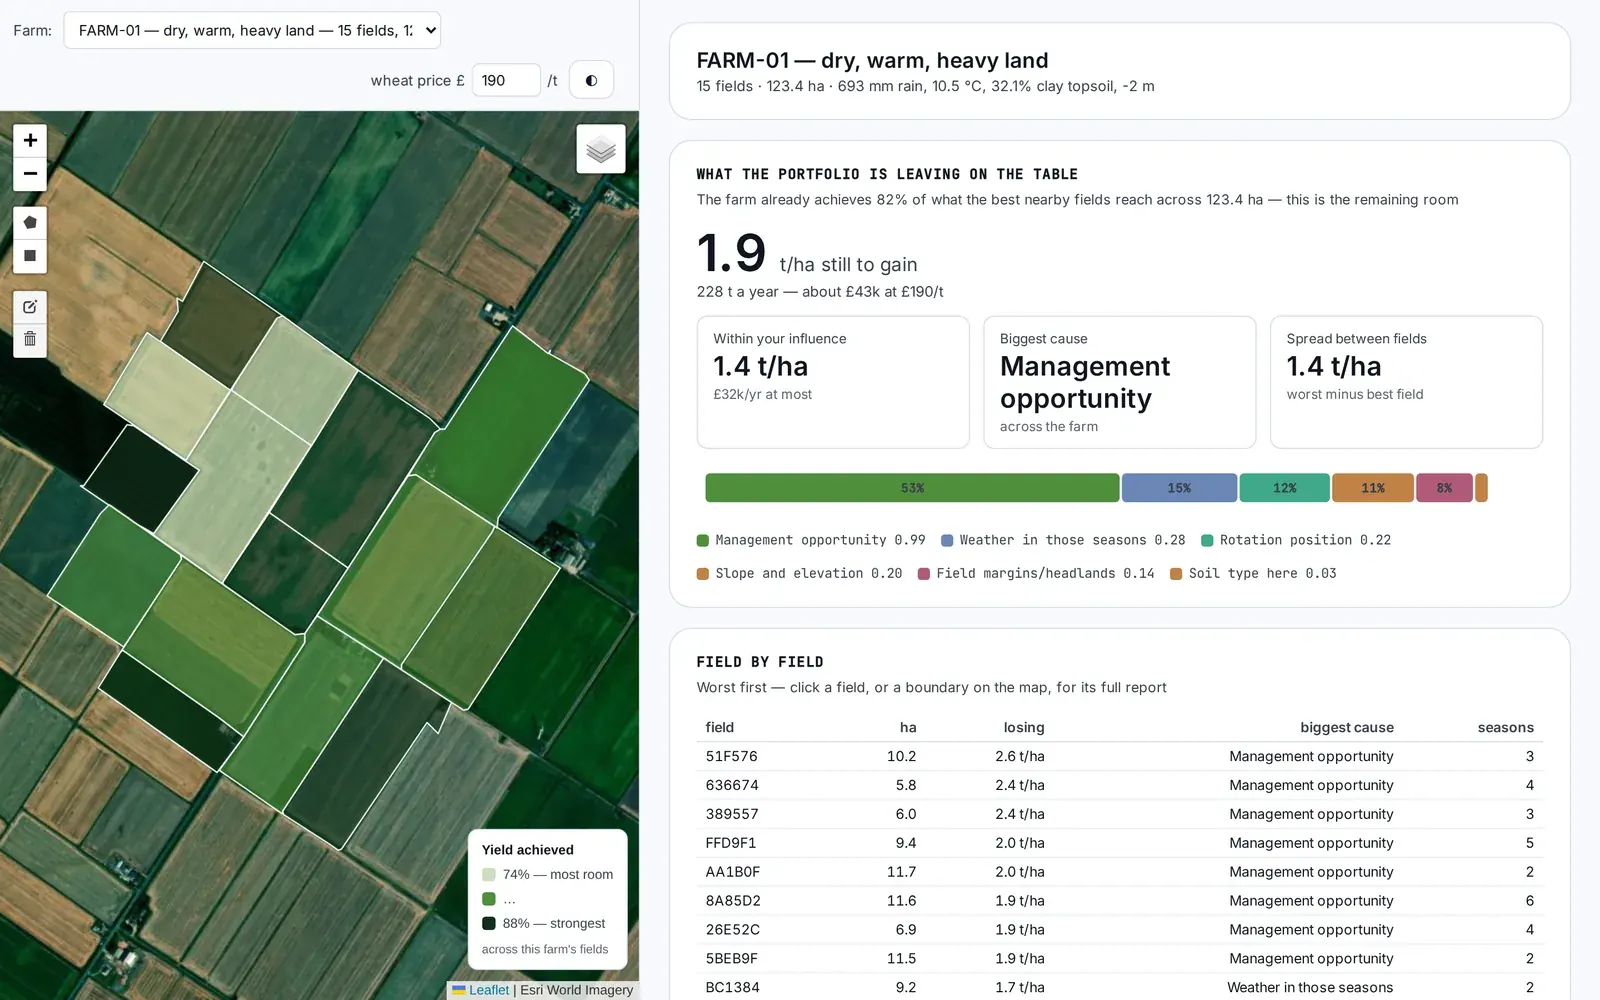
Field Passport · where the gap comes from

1.9 t/ha still to gain · demo farm

  • Management 0.99
  • Weather 0.28
  • Rotation 0.22
  • Slope 0.20
  • Field margins 0.14
  • Soil 0.03

t/ha by likely cause · 15 fields, 2018–2025

Field Passport demo: satellite map of a 15-field farm shaded by yield achieved, beside a panel showing 1.9 t/ha still to gain and a breakdown of likely causes.
Illustrative portfolio: real fields and satellite-derived figures (2018–2025), grouped into a farm for demonstration. Imagery © Esri.
01 / HISTORY Live

Field Passports

How has this field actually performed?

Season-by-season yield for every field, how stable it is, how far it sits from comparable fields nearby, and the likely reason — management, weather, rotation, slope, margins or soil.

Scale
Field and sub-field
Shows
Yield, stability, gap to best, likely cause
For
Agronomists, lenders, land agents, valuers
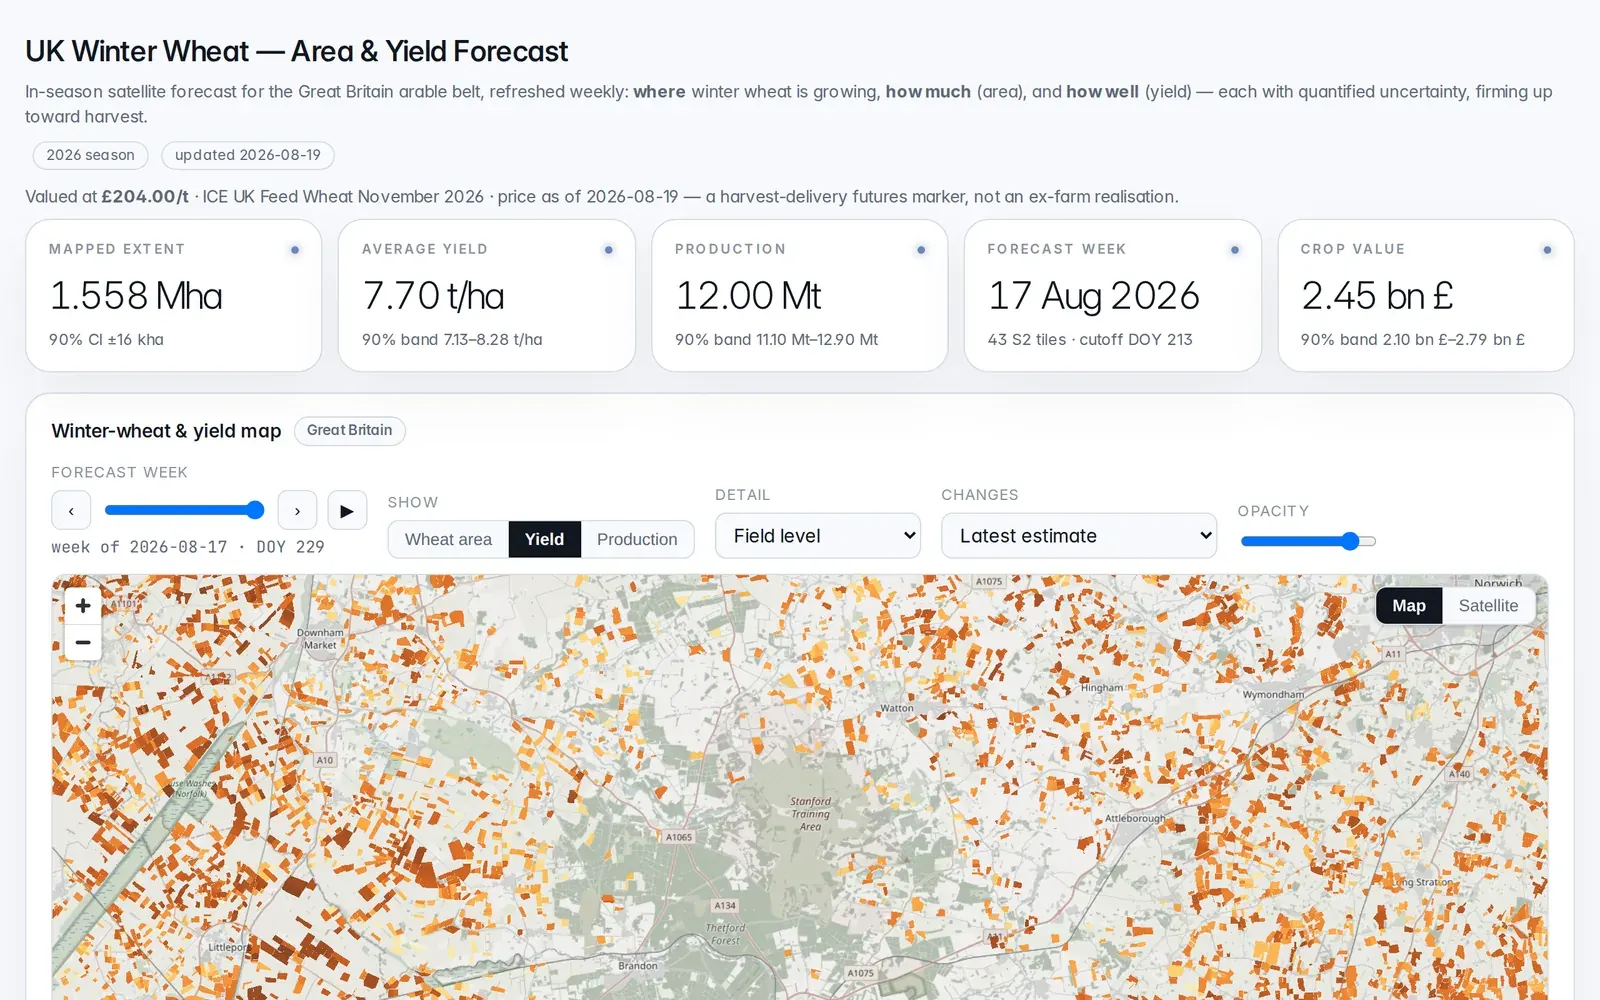
2026 UK winter-wheat forecast: headline area, yield and production with 90% bands, above a field-level yield map of East Anglia.
2026 GB forecast, week of 17 Aug. Produced with UCL and NCEO, with UKCEH, as part of the AgZero+ project. Basemap © OpenStreetMap contributors.
02 / FORECAST · GB Live

GB wheat forecast

What will this field, county or country produce?

Winter-wheat area, yield and production every week of the season — from a single field up to Great Britain, each with a 90% band that narrows towards harvest.

Levels
Field, county, region, nation
Updates
Weekly, with a dated, auditable issue
For
Grain buyers, processors, traders, agronomy
2026 US maize forecast: headline corn area, yield and production, above a 10 m field-level corn yield map of farmland in north Iowa.
2026 US maize forecast, issue of 7 Sep: 10 m field forecast of corn yield in north Iowa. Basemap © OpenStreetMap contributors.
03 / FORECAST · US Live

US maize forecast

How much corn is coming, and from where?

Corn area, yield and production across the core Corn Belt — Iowa, Illinois, Minnesota, Missouri and Wisconsin — from state and county down to the field.

Coverage
474 counties in five states
Levels
State, county, field (10 m)
Licence
Free for research (CC BY-NC 4.0); commercial licences from RayX
For
Grain traders, merchants, processors, risk desks
04 / INTEGRATION

Data and API

Put field-level yield history and forecasts inside the agronomy, farm-management and decision-support tools your customers already use.

  • CSV, API or bulk delivery
  • Field to national level
  • Uncertainty on every value
Discuss integration →
Why trust it

Built on physics. Designed for trust.

An independent, consistent view of what land has produced and what it is likely to produce — and the evidence to show why.

Traceable

Every value links back to the satellite observations behind it, with a dated record of each issue.

01
Uncertainty

A 90% band on every estimate, narrowing as the season firms up.

02
Validated

Checked against harvester yield data at field level.

03
Independent

One consistent method across every field and season — even where farm records are incomplete.

04

Build this with us.

RayX is early, and the partners who join now shape what gets built next. If one of these is you, we'd like to talk.

Pilot partners

Platforms · grain buyers · lenders

Agronomy and farm-software platforms to evaluate Field Passports across their fields. Grain buyers, processors and traders to run a season of wheat or maize forecasts against their current view. Lenders and land agents to test field history on real decisions.

Discuss a pilot →

Farms and farmer groups

Yield maps · field records

Share combine yield maps and field records to sharpen our validation. In return, you get free field reports and in-season forecasts for your farm.

Get involved →

Research and consortium partners

Science · trials · knowledge exchange

Environmental-science, crop-research and knowledge-exchange partners for collaborative R&D and on-farm trials.

Propose a project →

Investors

Pre-seed / seed

We're preparing our first round and welcome conversations with agri-food, climate and Earth-observation investors.

Talk to us →

RayX Field testers

Farmers · early access

Farmers who'd like early access to the RayX Field app. Send us a note and we'll add you to the test list.

Join the test list →

A decade of research, now live.

RayX is a UK agricultural intelligence company founded by Dr Feng Yin and developed from nearly a decade of Earth-observation research at UCL and the National Centre for Earth Observation (NCEO).

Built on satellite Earth observation, it gives an independent view of what land has produced, what it is likely to produce, where performance is persistently strong or weak, and how weather and management shape the outcome.

UCL · NCEO

Research heritage in Earth observation and crop science.

SIAC

Open-source atmospheric correction developed by our founder — peer-reviewed and assessed in the international ACIX-II intercomparison.

UKCEH · AgZero+

Partners on the 2026 GB winter-wheat forecast, produced with UCL and NCEO.

Less black box. More signal.

Clarity in every signal  ·  Confidence in every decision

Get in touch

Tell us what you're working on.

A pilot, farm data, a research project or an investment — the first step is a conversation.

contact@rayx.co.uk → LONDON · UK · RAYX LTD